Introduction
In some cases, you may want to generate a smooth curve through your data without extracting and interpreting fitted parameters. Fitting of this type is called nonparametric fitting. The Curve Fitting Tool supports these nonparametric fitting methods:
- Interpolants – Estimate values that lie between known data points.
- Smoothing spline – Create a smooth curve through the data. You adjust the level of smoothness by varying a parameter that changes the curve from a least squares straight-line approximation to a cubic spline interpolant.
Interpolants
Interpolation is a process for estimating values that lie between known data points. The supported interpolant methods are given below.
| Method | Description |
|---|---|
Linear |
Fit a different linear polynomial between each pair of data points. |
Nearest neighbor |
Set the value of an interpolated point to the value of the nearest data point. Note that this method does not generate any new data points. |
Cubic spline |
Fit a different cubic polynomial between each pair of data points. |
Shape-preserving |
Piecewise cubic Hermite interpolation (PCHIP). This method preserves monotonicity and the shape of the data. |
The type of interpolant you should use depends on the characteristics of the data being fit, the required smoothness of the curve, speed considerations, and post-fit analysis requirements. The linear and nearest neighbor methods are fast, but the resulting curves are not very smooth. The cubic spline and shape-preserving methods are slower, but the resulting curves are often very smooth.
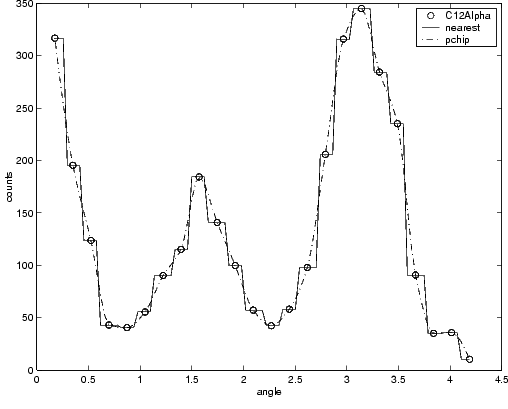
For example, the nuclear reaction data from the carbon12alpha data set are shown below with a nearest neighbor interpolant fit and a shape-preserving (PCHIP) interpolant fit. Clearly, the nearest neighbor interpolant does not follow the data as well as the shape-preserving interpolant. The difference between these two fits can be important if you are interpolating. However, if you want to integrate the data to get a sense of the total unnormalized strength of the reaction, then both fits provide nearly identical answers for reasonable integration bin widths.
Interpolants are defined as piecewise polynomials since the fitted curve is constructed from many “pieces.” For cubic spline and PCHIP interpolation, each piece is described by four coefficients, which are calculated using a cubic polynomial.
Parametric polynomial fits result in a global fit where one set of fitted coefficients describes the entire data set. As a result, the fit can be erratic. Since piecewise polynomials always produce a smooth fit, they are more flexible than parametric polynomials and can be effectively used for a wider range of data sets.
Smoothing spline
If your data is noisy, then you may want to fit it using a smoothing spline. Alternatively, you can use one of the smoothing methods described in Smoothing data.
The smoothing spline \(s\) is constructed for the specified smoothing parameter \(p\) and the specified weights \(w_{i}\), and minimizes the function:
\[p\sum_{i}w_{i}(y_{i} - s(x_{i}))^2 + (1 - p)\int{\left(d^{2}s \over dx^{2}\right)}^2dx\]If the weights are not specified, then they are assumed to be 1 for all data points.
\(p\) is defined between 0 and 1. \(p\) = 0 produces a least squares straight line fit to the data, while \(p\) = 1 produces a cubic spline interpolant. If you do not specify the smoothing parameter, then it is automatically selected in the “interesting range.” The interesting range of \(p\) is often near \(1/(1 + h^{3}/6)\) where \(h\) is the average spacing of the data points, and it is typically much smaller than the allowed range of the parameter. Since smoothing splines have an associated parameter, you can consider these fits to be parametric. However, smoothing splines are also piecewise polynomials like cubic spline or shape-preserving interpolants and are considered a nonparametric fit type in this guide.
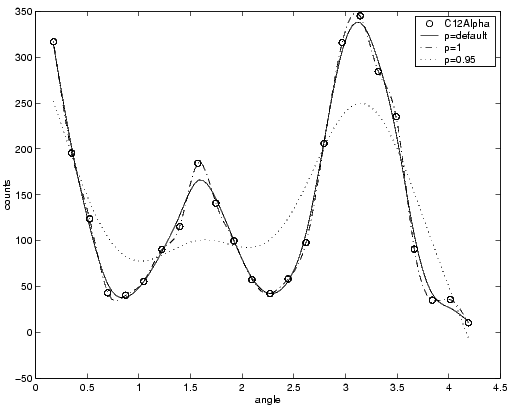
The nuclear reaction data from the carbon12alpha data file is shown below with three smoothing spline fits. The default smoothing parameter (\(p\) = 0.99) produces the smoothest curve. The cubic spline curve (\(p\) = 1) goes through all the data points, but is not quite as smooth. The third curve (\(p\) = 0.95) misses the data by a wide margin and illustrates how small the “interesting range” of \(p\) can be.
Example: Nonparametric fit
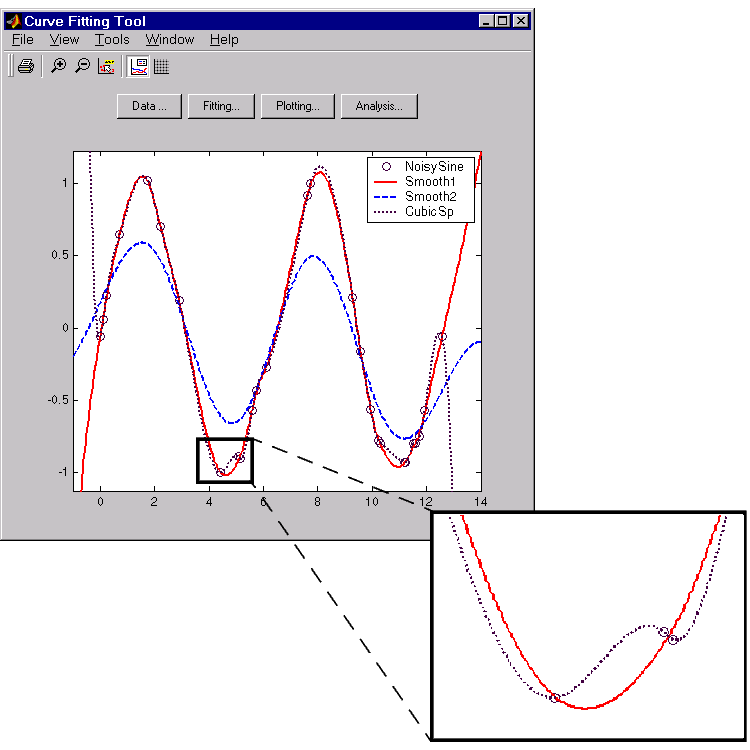
This example fits the following data using a cubic spline interpolant and several smoothing splines.
rand('state',0);
x = (4*pi)*[0 1 rand(1,25)];
y = sin(x) + .2*(rand(size(x))-.5);
As shown below, you can fit the data with a cubic spline by selecting Interpolant from the Type of fit list.
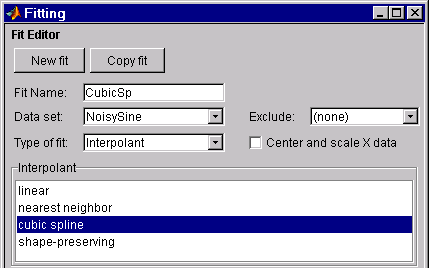
The results shown below indicate that goodness of fit statistics are not defined for interpolants.
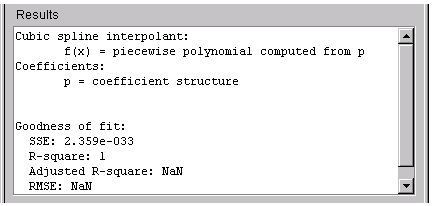
Cubic spline interpolation is defined as a piecewise polynomial that results in a structure of coefficients. The number of “pieces” in the structure is one less than the number of fitted data points, and the number of coefficients for each piece is four since the polynomial is cubic. The tool does not allow you to access the structure of coefficients.
As shown below, you can fit the data with a smoothing spline by selecting Smoothing Spline in the Type of fit list.
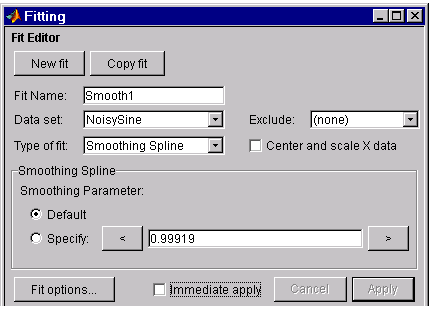
The level of smoothness is given by the Smoothing Parameter. The default smoothing parameter value depends on the data set, and is automatically calculated by the tool after you press the Apply button.
For this data set, the default smoothing parameter is close to 1, indicating that the smoothing spline is nearly cubic and comes very close to passing through each data point. Create a fit for the default smoothing parameter and name it Smooth1. If you don’t like the level of smoothing produced by the default smoothing parameter, you can specify any value between 0 and 1. A value of 0 produces a piecewise linear polynomial fit, while a value of 1 produces a piecewise cubic polynomial fit, which passes through all the data points. For comparison purposes, create another smoothing spline fit using a smoothing parameter of 0.5 and name the fit Smooth2.
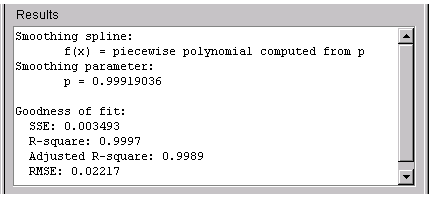
The numerical results for the smoothing spline fit Smooth1 are shown below.
The data and fits are shown below. The default abscissa scale was increased to show the fit behavior beyond the data limits. You change the axes limits with Tools > Axes Limit Control.