Syntax
cftool
cftool(xdata,ydata)
where
xdata |
A vector of predictor data |
ydata |
A vector of response data |
Description
cftool opens the curve fitting tool.
cftool(xdata,ydata) opens the Curve Fitting Tool with predictor data specified by xdata and response data specified by ydata. Infs and NaNs are ignored and only the real component of a complex value is used.
Example
The Curve Fitting Tool is a graphical user interface (GUI) that allows you to:
- Visually explore data and fits as scatter plots.
- Graphically evaluate the goodness of fit using residuals and prediction bounds.
- Access GUIs for importing and fitting data, and for plotting and analyzing fits to the data.
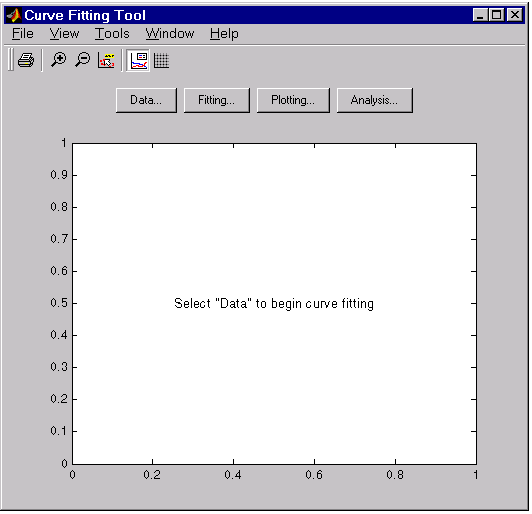
The Curve Fitting Tool is shown below. By selecting the Data, Fitting, Plotting, and Analysis buttons, you can start the associated GUIs, which are described in the sections below.

The Data GUI
The Data GUI allows you to:
- Import, preview, name, and delete data sets.
- View the imported data.
- Exclude and section data from a fit.
- Smooth noisy data.
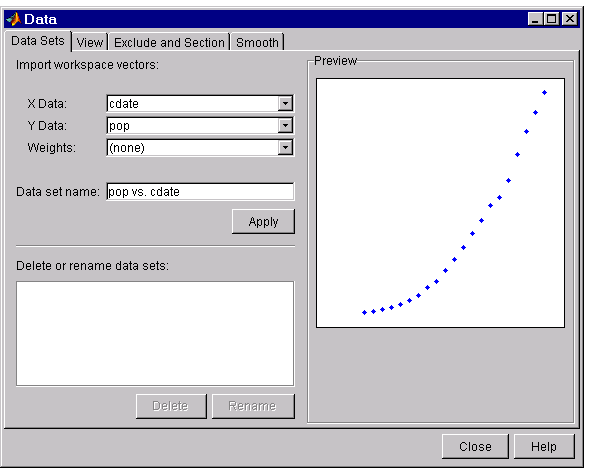
The Data GUI is shown below with the census data loaded.

The Fitting GUI
The Fitting GUI allows you to:
- Fit data using a library or custom equation, a smoothing spline, or an interpolant.
- Examine and compare fit results including fitted coefficient values and goodness of fit statistics.
- Keep track of all the data sets and fits for the current session.
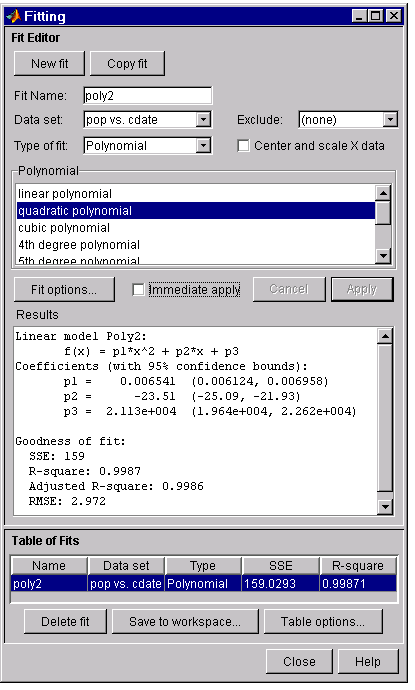
The Fitting GUI shown below displays the results of fitting the census data to a quadratic polynomial.

The Analysis GUI
The Analysis GUI allows you to:
- Evaluate (interpolate or extrapolate), differentiate, or integrate a fit.
- Plot the analysis results and the data set.
The Analysis GUI shown below displays the numerical results of extrapolating the census data from the year 2000 to the year 2050 in 10-year increments.

The Plotting GUI
The Plotting GUI allows you to control the data sets and fits displayed by the curve fitting tool. The Plotting GUI shown below indicates that the data set pop vs cdate and the fit poly2 are currently displayed.
