Introduction
The Curve Fitting Tool provides you with several options for saving your work. For example, you can save one or more fits and the associated fit results as variables to the workspace. You can then use this saved information for documentation purposes, or to extend your data exploration and analysis. In addition to saving your work to workspace variables, you can:
- Save the session.
- Save a script file.
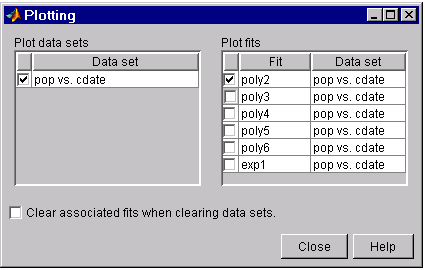
Before performing any of these tasks, you may want to remove unwanted data sets and fits from the Curve Fitting Tool display. An easy way to do this is with the Plotting GUI. The Plotting GUI shown below is configured to display only the census data and the best fit, poly2.

Saving the session
The curve fitting session is defined as the current collection of fits for all data sets. You may want to save your session so that you can continue data exploration and analysis at a later time without losing any current work.
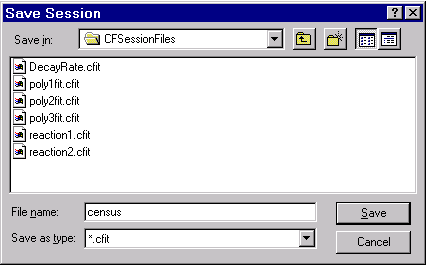
Save the current session by selecting the menu item File > Save Session from the Curve Fitting Tool. The Save Session dialog is shown below.

The session is stored in binary form in a cfit file, and contains the following information:
- All data sets and associated fits.
- The state of the Fitting GUI including
Table of Fitsentries and excluded data sets. - The state of the Plotting GUI.
To avoid saving unwanted data sets, you should delete them from the tool. You delete data sets using the Data Sets tab of the Data GUI. If there are fits associated with the unwanted data sets, they are deleted as well.
You can load a saved session by selecting the menu item File > Load Session from the Curve Fitting Tool. When the session is loaded, the saved state of the tool is reproduced, and may display the data, fits, residuals, and so on. If you open the Fitting GUI, then the loaded fits are displayed in the Table of Fits. Select a fit from this table to continue your curve fitting session.
Saving a script file
You may want to generate a script file so that you can continue data exploration and analysis from the command line. You can run the script file without modification to recreate the fits and results that you created in the Curve Fitting Tool, or you can edit and modify the file as needed.
If you have many data sets to fit and you want to automate the fitting process, you can select the appropriate model and fit options, generate a script file, and then run the file in batch mode.
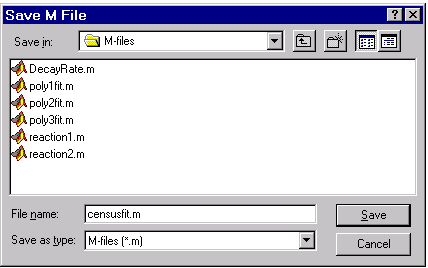
Save your work to a script file by selecting the menu item File > Save script file from the Curve Fitting Tool. The Save File dialog is shown below.

The script file captures the following information:
- All data set variable names, associated fits, and residuals.
- Fit options such as the fit starting points, the fitting method, and whether the data should be normalized.
You can recreate the saved fits in a new figure window by typing the name of the script file at the command line. Note that you must provide the appropriate data variables as inputs. These variables are given in the script file help.
For example, the help for censusfit indicates that the variables cdate and pop are required to recreate the fit.
help censusfit
 CENSUSFIT    Create plot of datasets and fits
    CENSUSFIT(CDATE,POP)
    Creates a plot, similar to the plot in the main curve fitting
    window, using the data that you provide as input.  You can
    apply this function to the same data you used with cftool
    or with different data.  You may want to edit the function to
    customize the code and this help message.

    Number of datasets:  1
    Number of fits:  6