Import data into the workspace and load into the tool.
Load the census data
In this section you will fit US census data to several library models, find the best fit, and extrapolate the best fit to predict the US population in future years.
The first step is to load the census data from the census data file.
load census
The workspace now contains two new variables:
cdateis a column vector containing the years 1790 to 1990 in 10-year increments.popis a column vector with the US population figures that correspond to the years incdate.
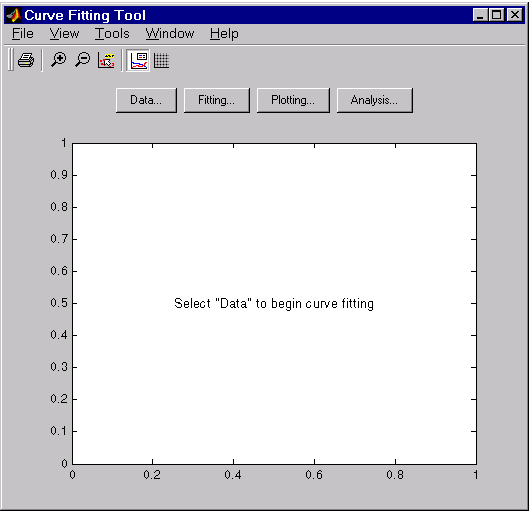
Open the Curve Fitting Tool
The Curve Fitting Tool is a graphical user interface (GUI) that allows you to:
- Visually explore one or more data sets and fits as scatter plots.
- Graphically evaluate the goodness of fit using residuals and prediction bounds.
- Access additional interfaces for importing and fitting data, and for plotting and analyzing fits to the data.
You open the curve fitting tool with the cftool command:
cftool

Import data with the Data GUI
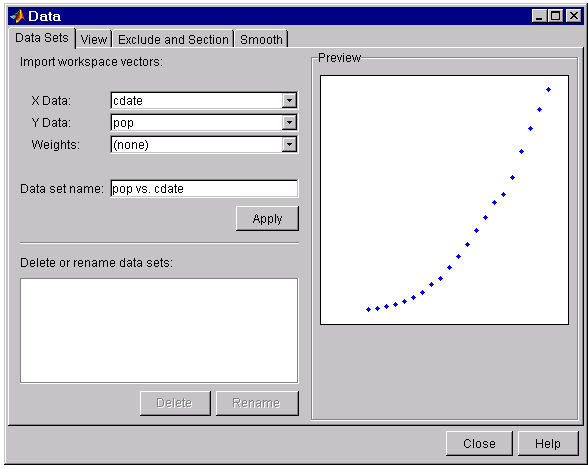
You import data into the Curve Fitting Tool with the Data GUI. The Data GUI allows you to:
- Import predictor (X) data, response (Y) data, and weights. If you do not import weights, they are assumed to be 1 for all data points.
- Specify the name of the data set.
- Preview the data.
To load cdate and pop into the Curve Fitting Tool:
- Press the Data button to open the Data GUI.
- Select the appropriate variable names from the X Data and Y Data lists. The data is then displayed in the Preview window.
- Press the Apply button to complete the data import process.
